Know where the year will land, while there is still time to act
HealthOS prices every coded episode in National Weighted Activity Units as it is coded, by IHACPA’s National Efficient Price Determination, and keeps the position live: where the year stands against target, where it is heading, what tonight’s inpatients add, and how close you are to the Commonwealth cap. Part of HealthOS Insights, in HealthOS PaaS.
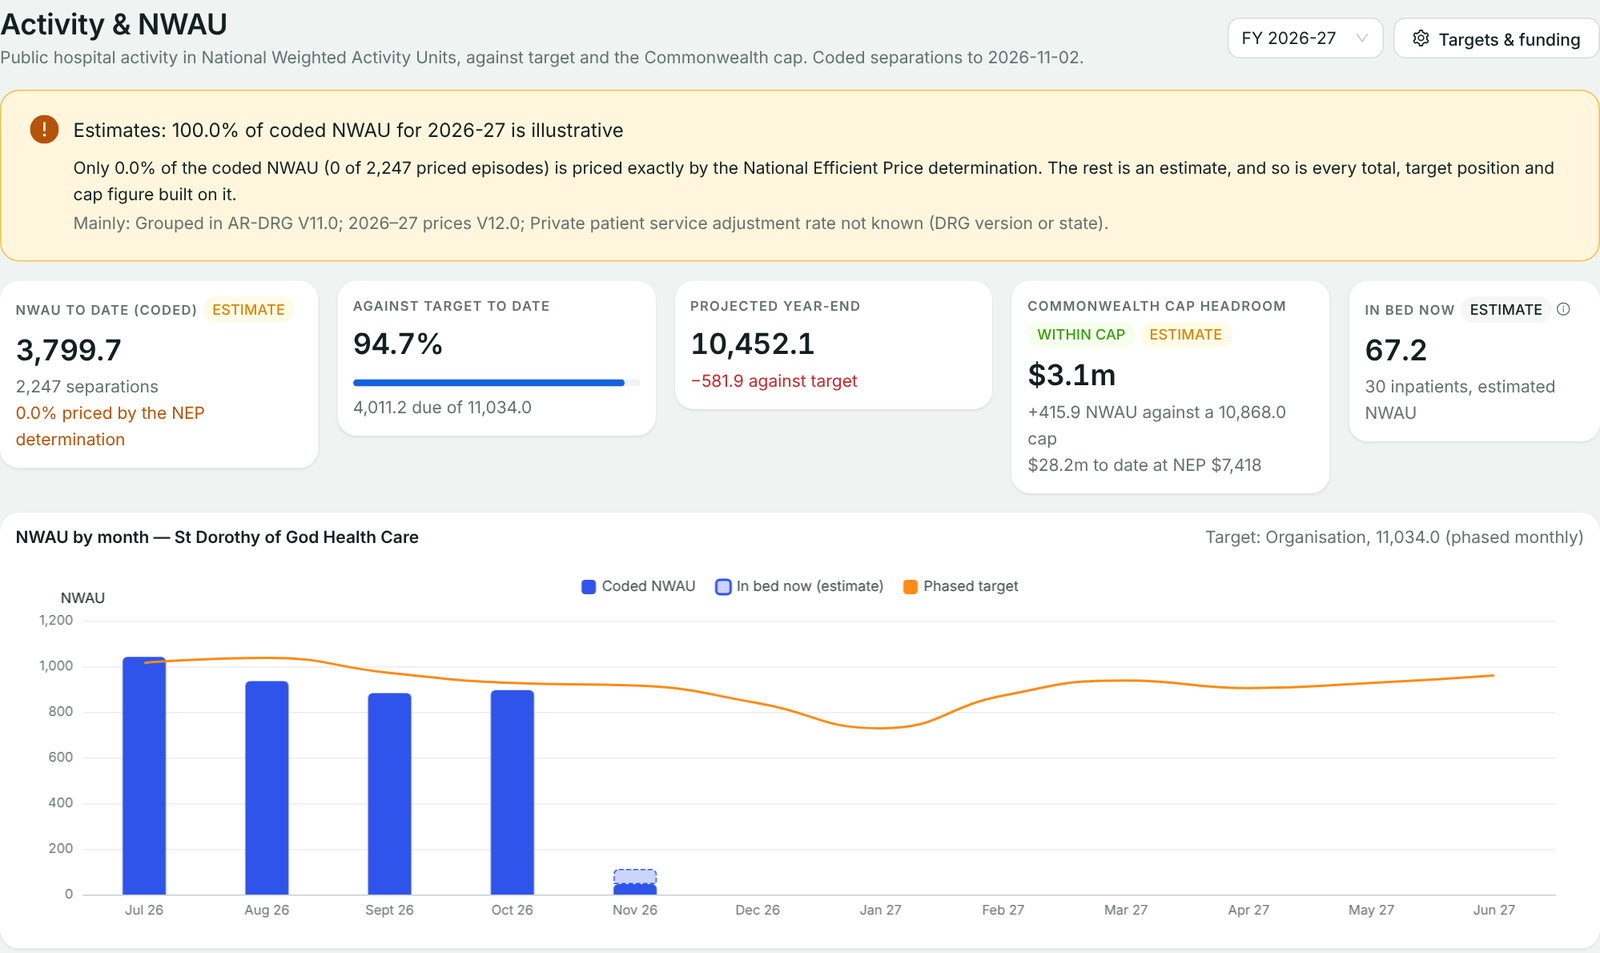
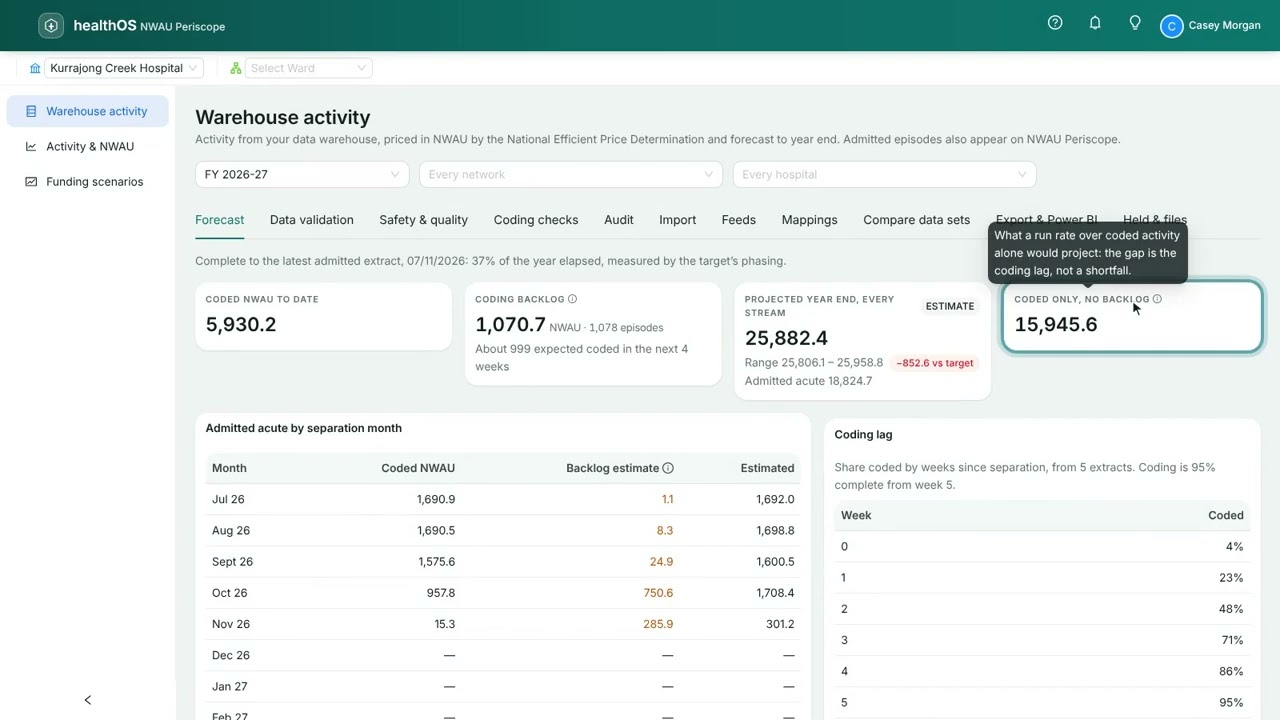
NWAU to date against a target phased to your year.
The projected year-end and the gap to target, at every level.
Tonight’s inpatients priced as an estimate, kept apart from coded activity.
Headroom against the Commonwealth cap, in NWAU and dollars.
Funding scenarios for next year’s prices and rules.
Activity-based funding you can see during the year, not after it
Every episode in NWAU, the way the determination says
When an episode is grouped for coding, HealthOS prices it in National Weighted Activity Units by IHACPA’s National Efficient Price Determination: the price weight for the stay, then each adjustment in the order the determination applies it, from paediatric and Indigenous status to remoteness, ICU hours and the private patient adjustment, with the shadow pricing of hospital-acquired complications and avoidable readmissions where the determination sets it. The working is kept with the episode, so a figure can always be explained. Subacute and non-acute care (AN-SNAP), mental health (AMHCC), emergency (AECC) and non-admitted care (Tier 2) are priced too, from the same determination.
- NWAU(26) by the National Efficient Price Determination 2026–27
- Every adjustment kept, step by step, with the episode
- Admitted acute, subacute, mental health, emergency and non-admitted activity
- Remoteness from the ABS postcode correspondence, loaded once
Against target, phased the way your year really runs
Set an NWAU target for the organisation, each hospital and each division, and phase it by month, so a winter peak or a quiet January is planned for rather than read as a miss. The page shows NWAU to date against what the phasing says was due by now, for the whole organisation and every level below it.
- Targets for the organisation, hospitals and divisions
- Monthly phasing, so seasonal years are judged fairly
- The year by month against target, at a glance
The projected year-end, with the gap to target
From the year so far against your phasing, HealthOS projects where each hospital, division and ward will finish the year, and how far that is from target. It is a projection from your own activity, not a black box: the method is stated on screen, so the people who answer for the money can explain the number to the board.
- Projected year-end NWAU at every level
- The projected gap to target, in NWAU
- Recalculated every night as coding lands
The activity you have not coded yet
Coded activity lags the patients in your beds. Each night, HealthOS prices tonight’s inpatients from their provisional groupings by the same rules as coded activity, on the stay they were grouped with. It is shown as its own estimate, in its own tile, column and bar, and is never added to coded totals.
- Current inpatients priced as NWAU, nightly
- Always labelled an estimate, never mixed into coded totals
- Shown at every level of the drill-down
How much headroom is left, in NWAU and dollars
Enter the National Efficient Price and your Commonwealth cap, and the page shows where the organisation stands against the cap: within it, near it or projected over it, in NWAU and in dollars at the published NEP.
- Within cap, near cap or projected over cap
- Headroom in NWAU and in dollars
- Dollars only at organisation level
From the region to the ward, and on to the episode
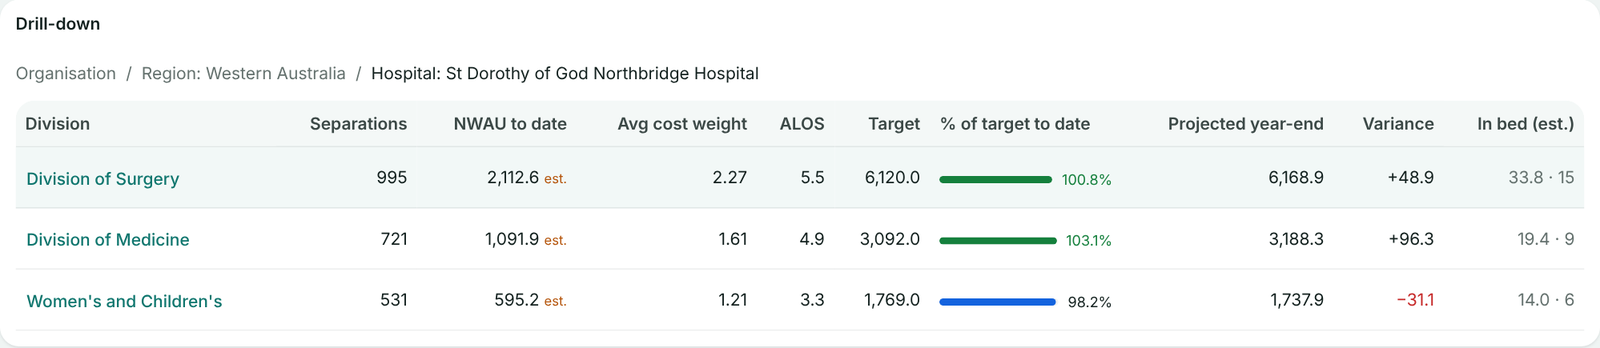
Every figure opens up: region, hospital, division, specialty and ward, then the episodes behind them, each with its own DRG and NWAU. When a division is behind, you can see which ward and which episodes, not just that it is.
- Region, hospital, division, specialty, ward, episode
- Each episode’s DRG and NWAU
- Coded and estimated activity side by side, never summed
See what a change does before it happens
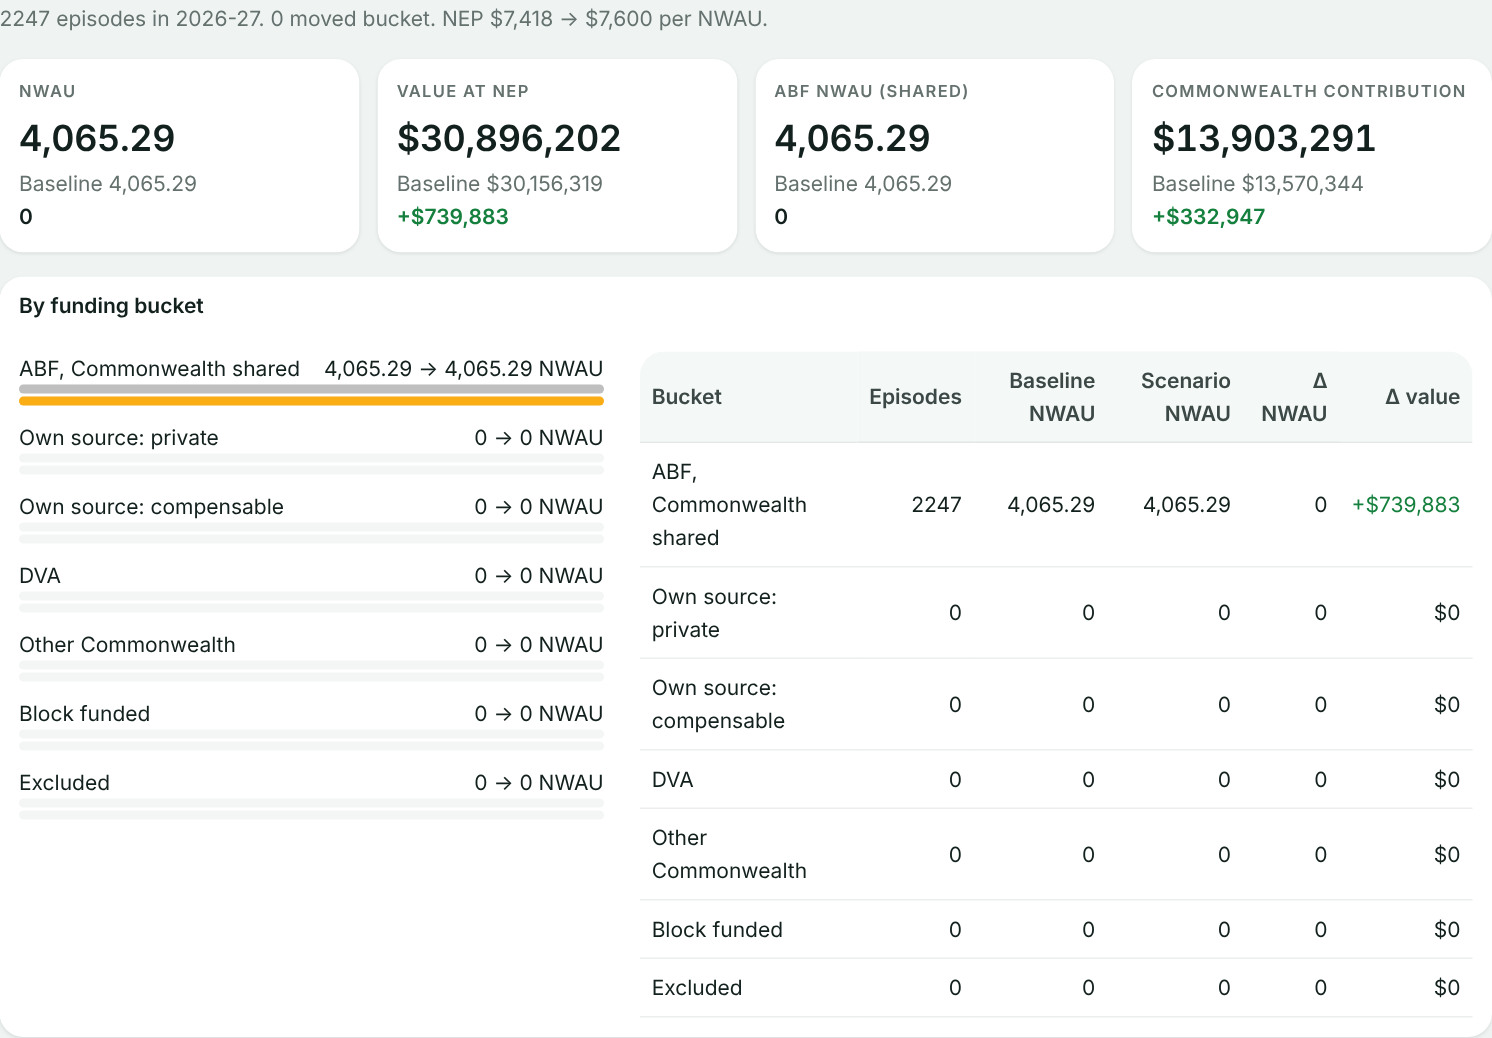
Re-price a year’s coded episodes under different settings and compare: next year’s price weights, a changed adjustment such as the Indigenous loading, a different NEP or Commonwealth contribution rate, or episodes moved between funding buckets. Use it before a service agreement is signed, not after. Scenarios are portfolio totals, never a figure per code.
- Another year’s price weights, NEP or adjustment
- Episodes reassigned between funding buckets
- The Commonwealth contribution under each scenario
- Totals only, for the finance team
Every number says where it came from
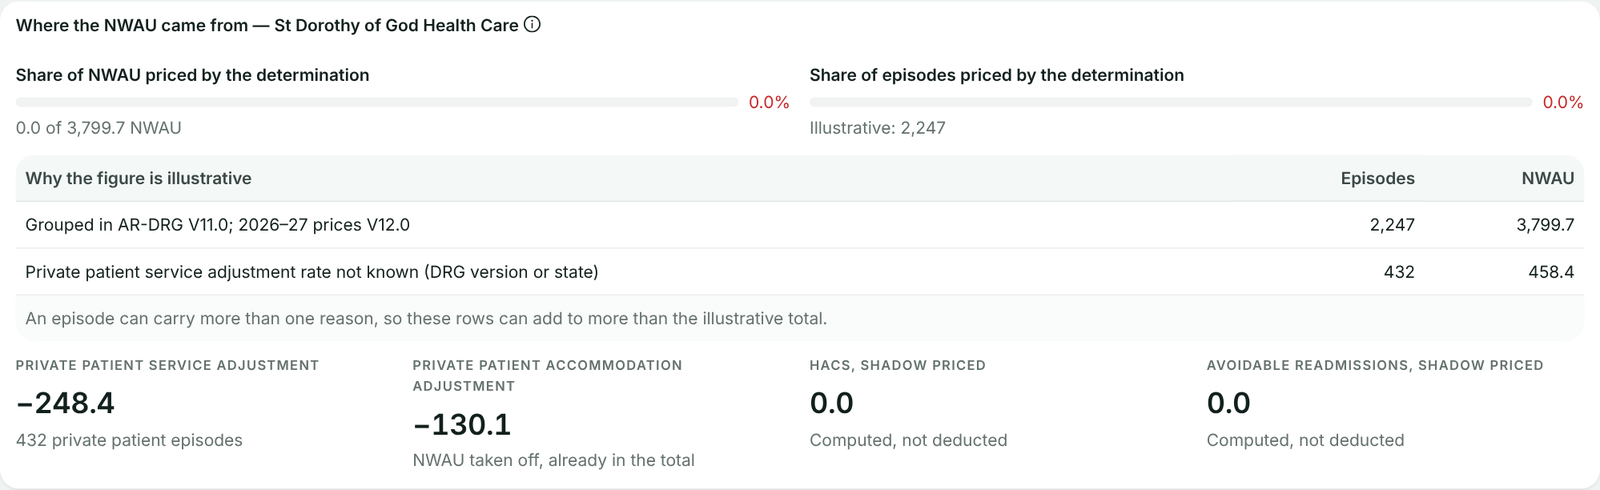
Each figure is marked as priced by the loaded determination or as illustrative, and the page says how much of the total is illustrative, broken down by reason. The national and state extracts carry only the NWAU HealthOS actually priced; a figure it did not calculate is left blank rather than guessed.
- Determination-priced or illustrative, on every figure
- The illustrative share stated, with the reasons
- Extracts report only what was priced
What it will never do
Funding figures beside coding invite the wrong question. HealthOS is designed so they cannot be read that way.
| Rule | Why |
|---|---|
| No money beside an individual code | NWAU and dollars are shown for an episode, a ward or the organisation, never as what a single diagnosis or procedure is worth. |
| No coding towards a DRG | Nothing suggests codes to add for a higher grouping, and Code Captain, the AI coder, never sees the DRG, cost weight or NWAU. |
| Estimates never pass as coded activity | The in-bed estimate and illustrative figures are labelled wherever they appear, and never added to coded totals. |
| Nothing invented for the state or the AIHW | An extract carries the NWAU HealthOS priced from the determination, or leaves the field blank. |
The fine print, up front
| Question | Answer |
|---|---|
| How is the year-end projected? | From the NWAU coded so far against your monthly phasing of the target: if you are 4% ahead of what the phasing says was due by now, the year is projected to finish 4% above target. It is a projection from your own activity, stated on screen, not a forecast model. |
| Why are some 2026–27 figures marked illustrative? | The National Efficient Price Determination 2026–27 prices AR-DRG Version 12.0. An episode grouped with Version 11.0 cannot be priced from those weights exactly, so HealthOS marks its figure illustrative and says how much of the total that affects, rather than presenting it as the determination’s. |
| What do we need to set up? | Your targets and their phasing, the NEP and your Commonwealth cap, and the ABS postcode-to-remoteness correspondence. The price weights come from IHACPA’s published determination. |
| Who can see it? | Finance, casemix and executive roles. Funding scenarios return portfolio totals only. |
| Is it in the HealthOS SaaS products? | Not yet. Today NWAU Periscope runs in HealthOS Insights, in HealthOS PaaS, and it is coming as a standalone HealthOS SaaS product too. The Code Navigator shows the NWAU of the episode being coded. |
Price weights and adjustments from the National Efficient Price Determination 2026–27, © Independent Health and Aged Care Pricing Authority, used under CC BY 4.0.
See it in action
 4:24
Related
See your year in NWAU
We’ll walk your finance team through it on a demonstration year of activity.