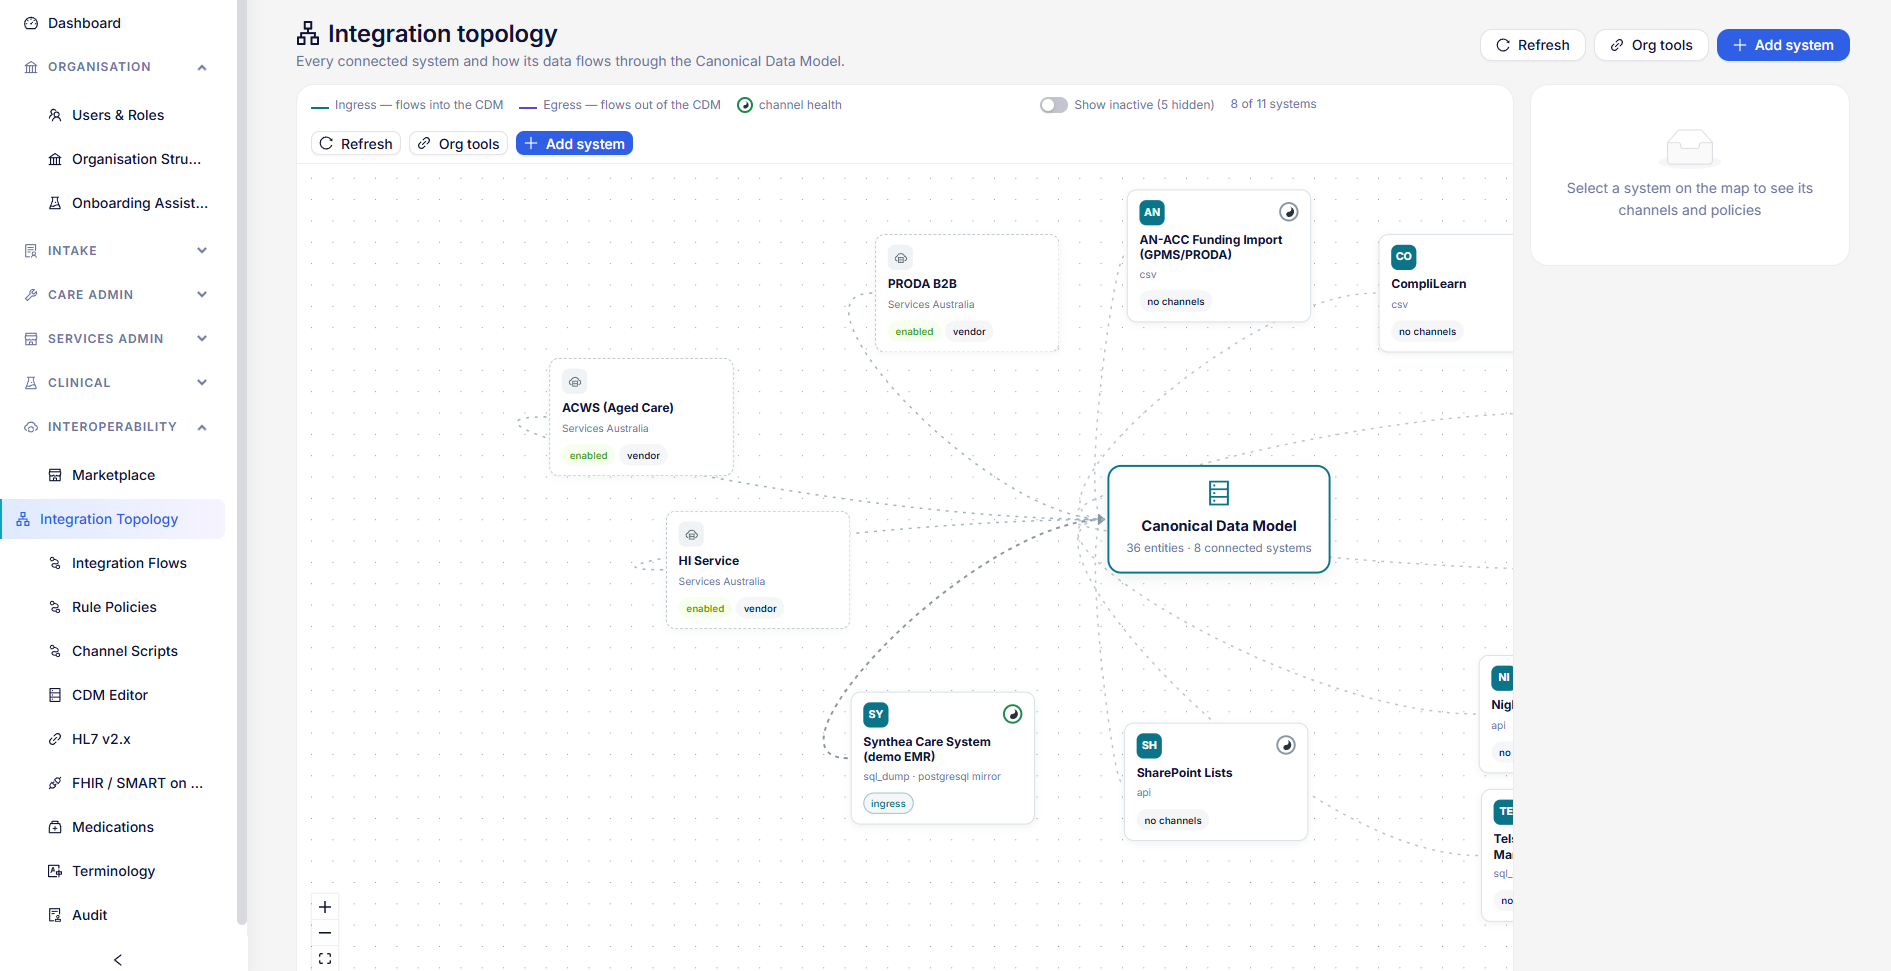
Run on the live record, with numbers you can trace
Ask a question in plain English and HealthOS finds the matching measure, so every figure in the board pack traces back to the care that produced it.
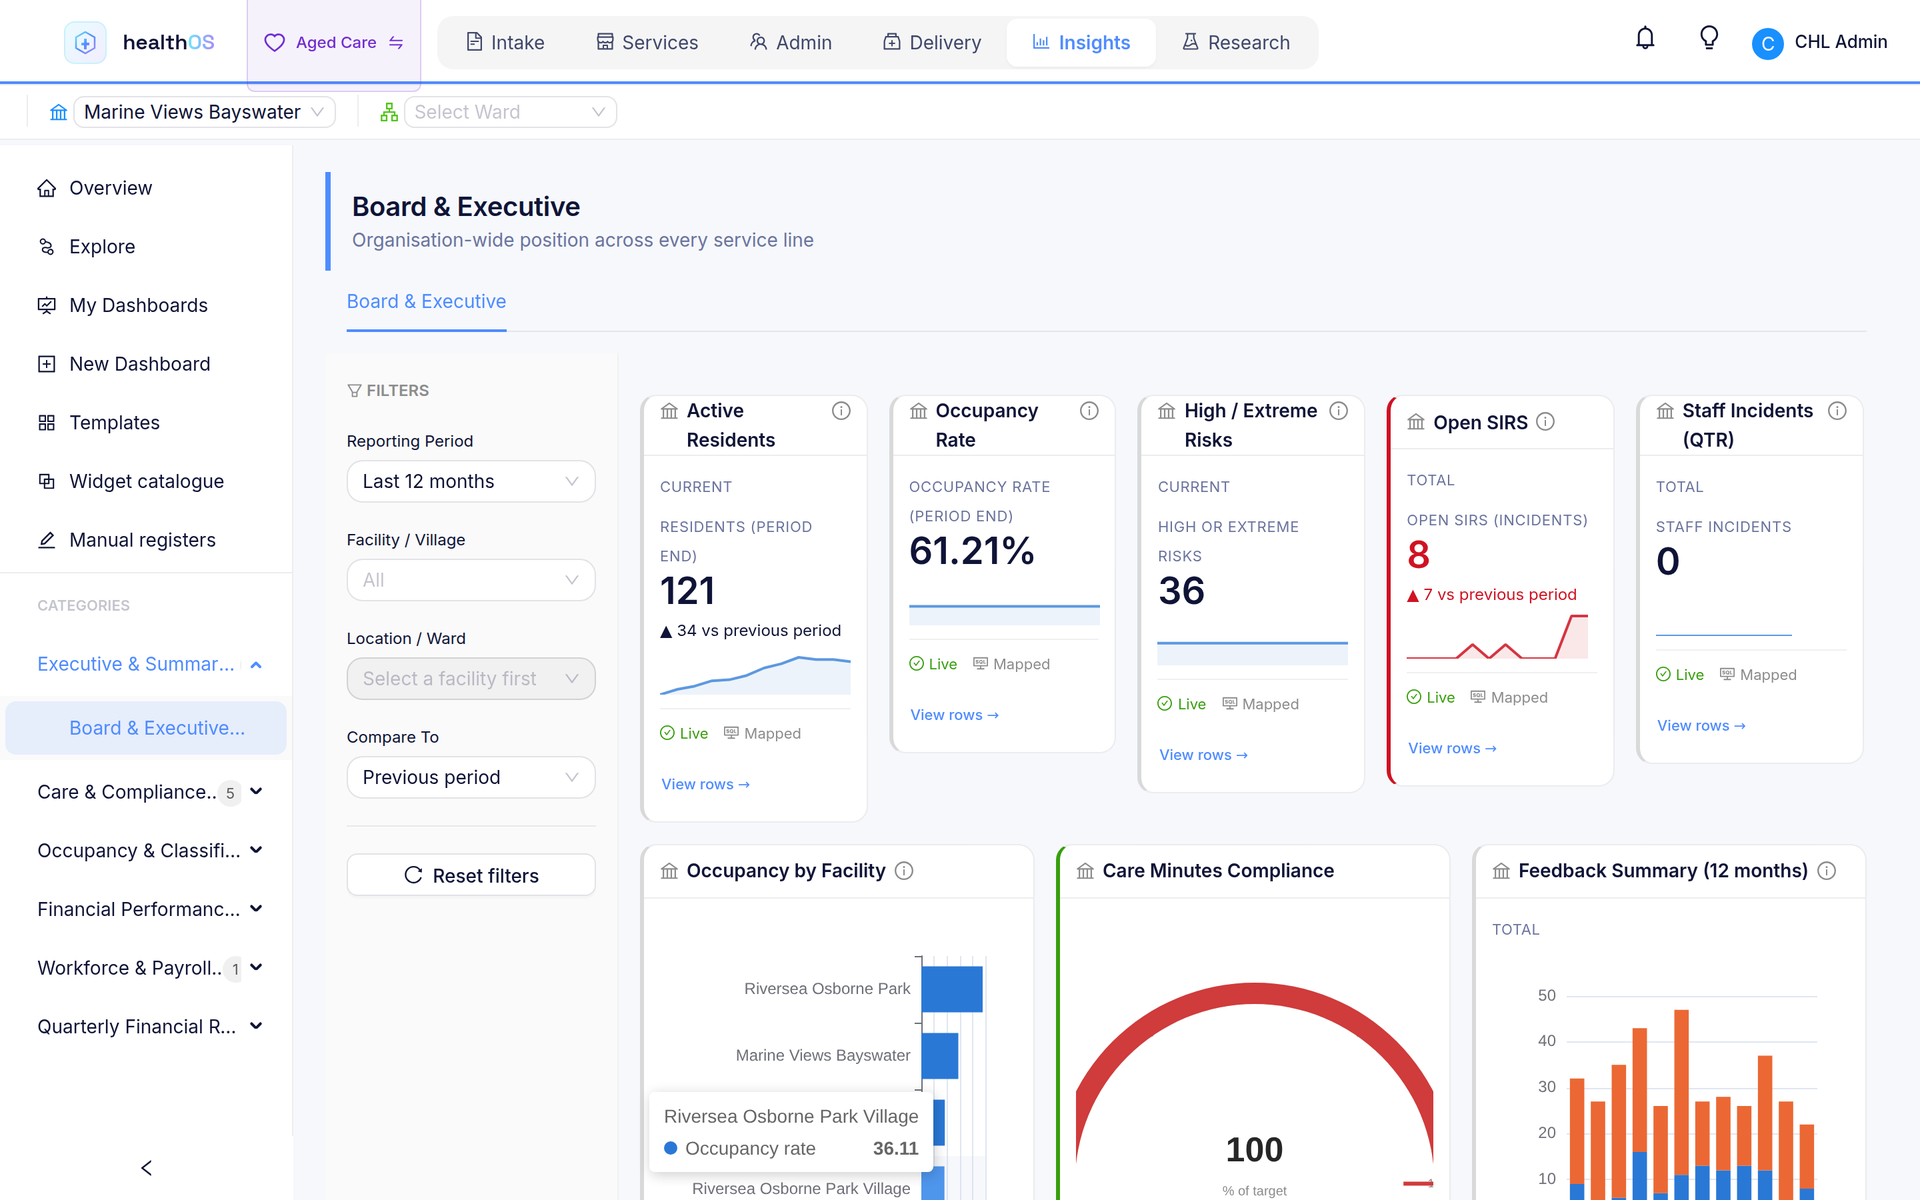
Ward bed occupancy and how full the theatre lists are, from the beds and lists your teams already manage.
Occupancy trends and incident rates per 1,000 bed-days, with premium revenue tracked separately from funded care.
Funding-stream analytics across Support at Home, CHSP and DVA.
Plan utilisation across participants.
Fewer spreadsheets, more answers
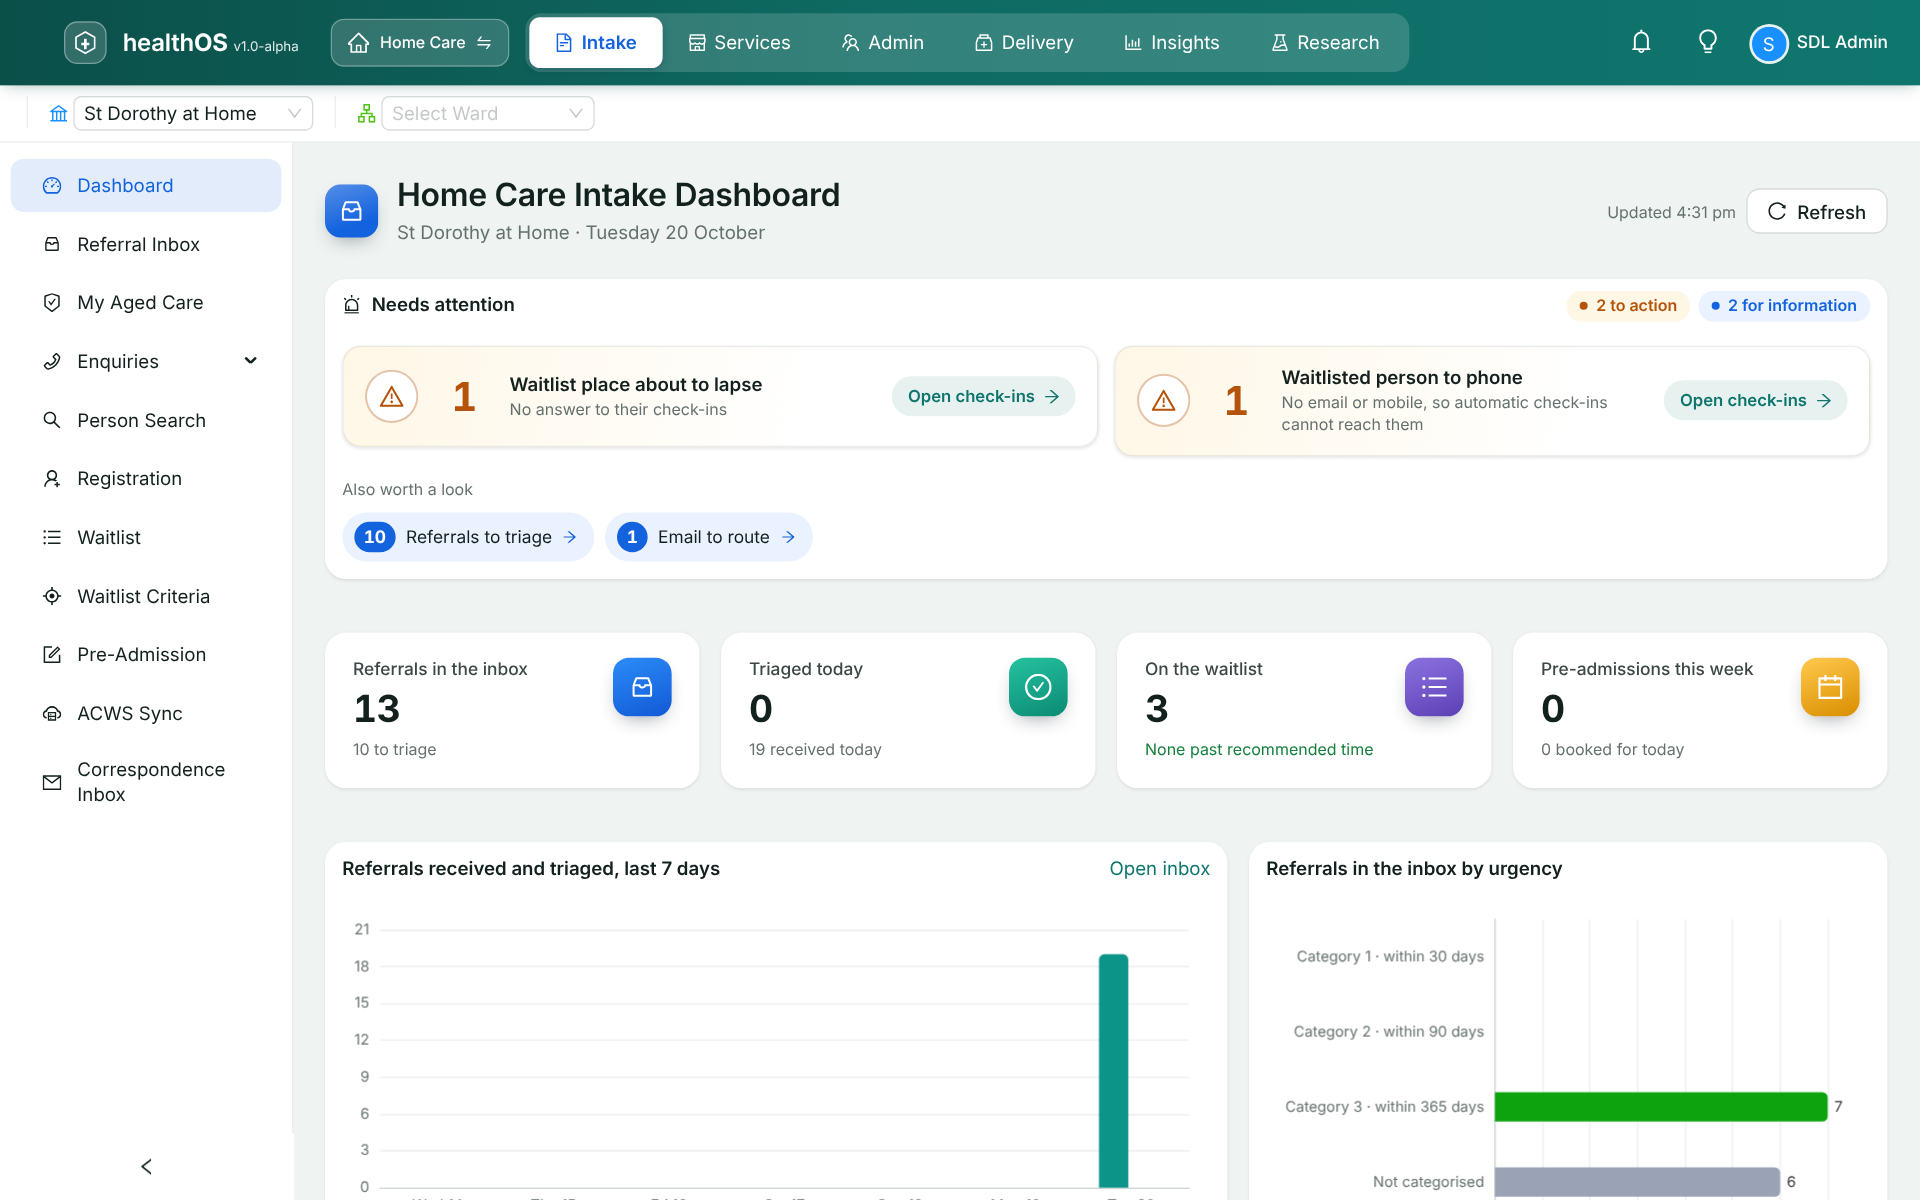
Ask in plain English
Type a question like “show me falls by facility this quarter.” The answer is a chart built from certified measures, naming the ones it used, so the number you take to the board is one you can check. The same measures sit behind every dashboard, so the board and the home manager are never looking at two different numbers for the same thing.
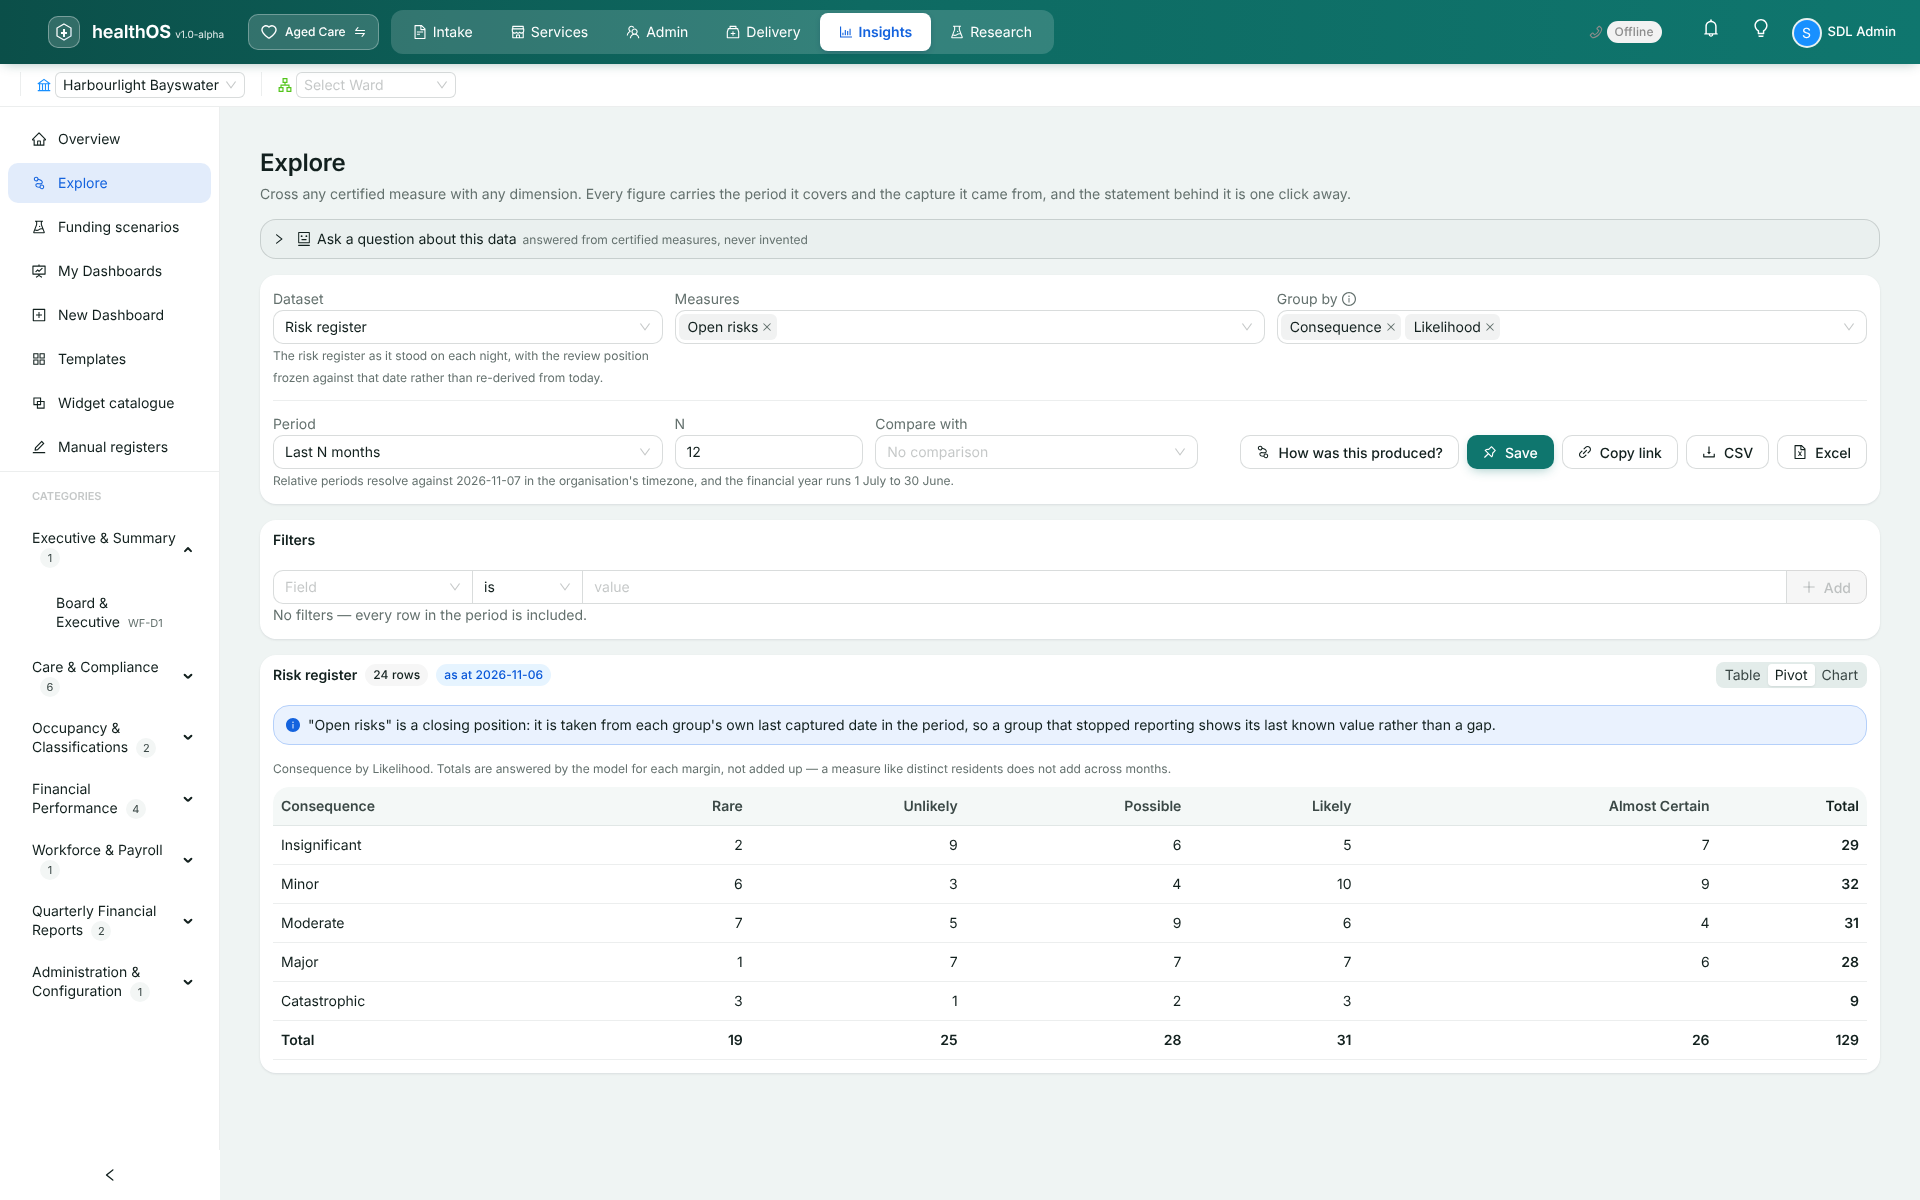
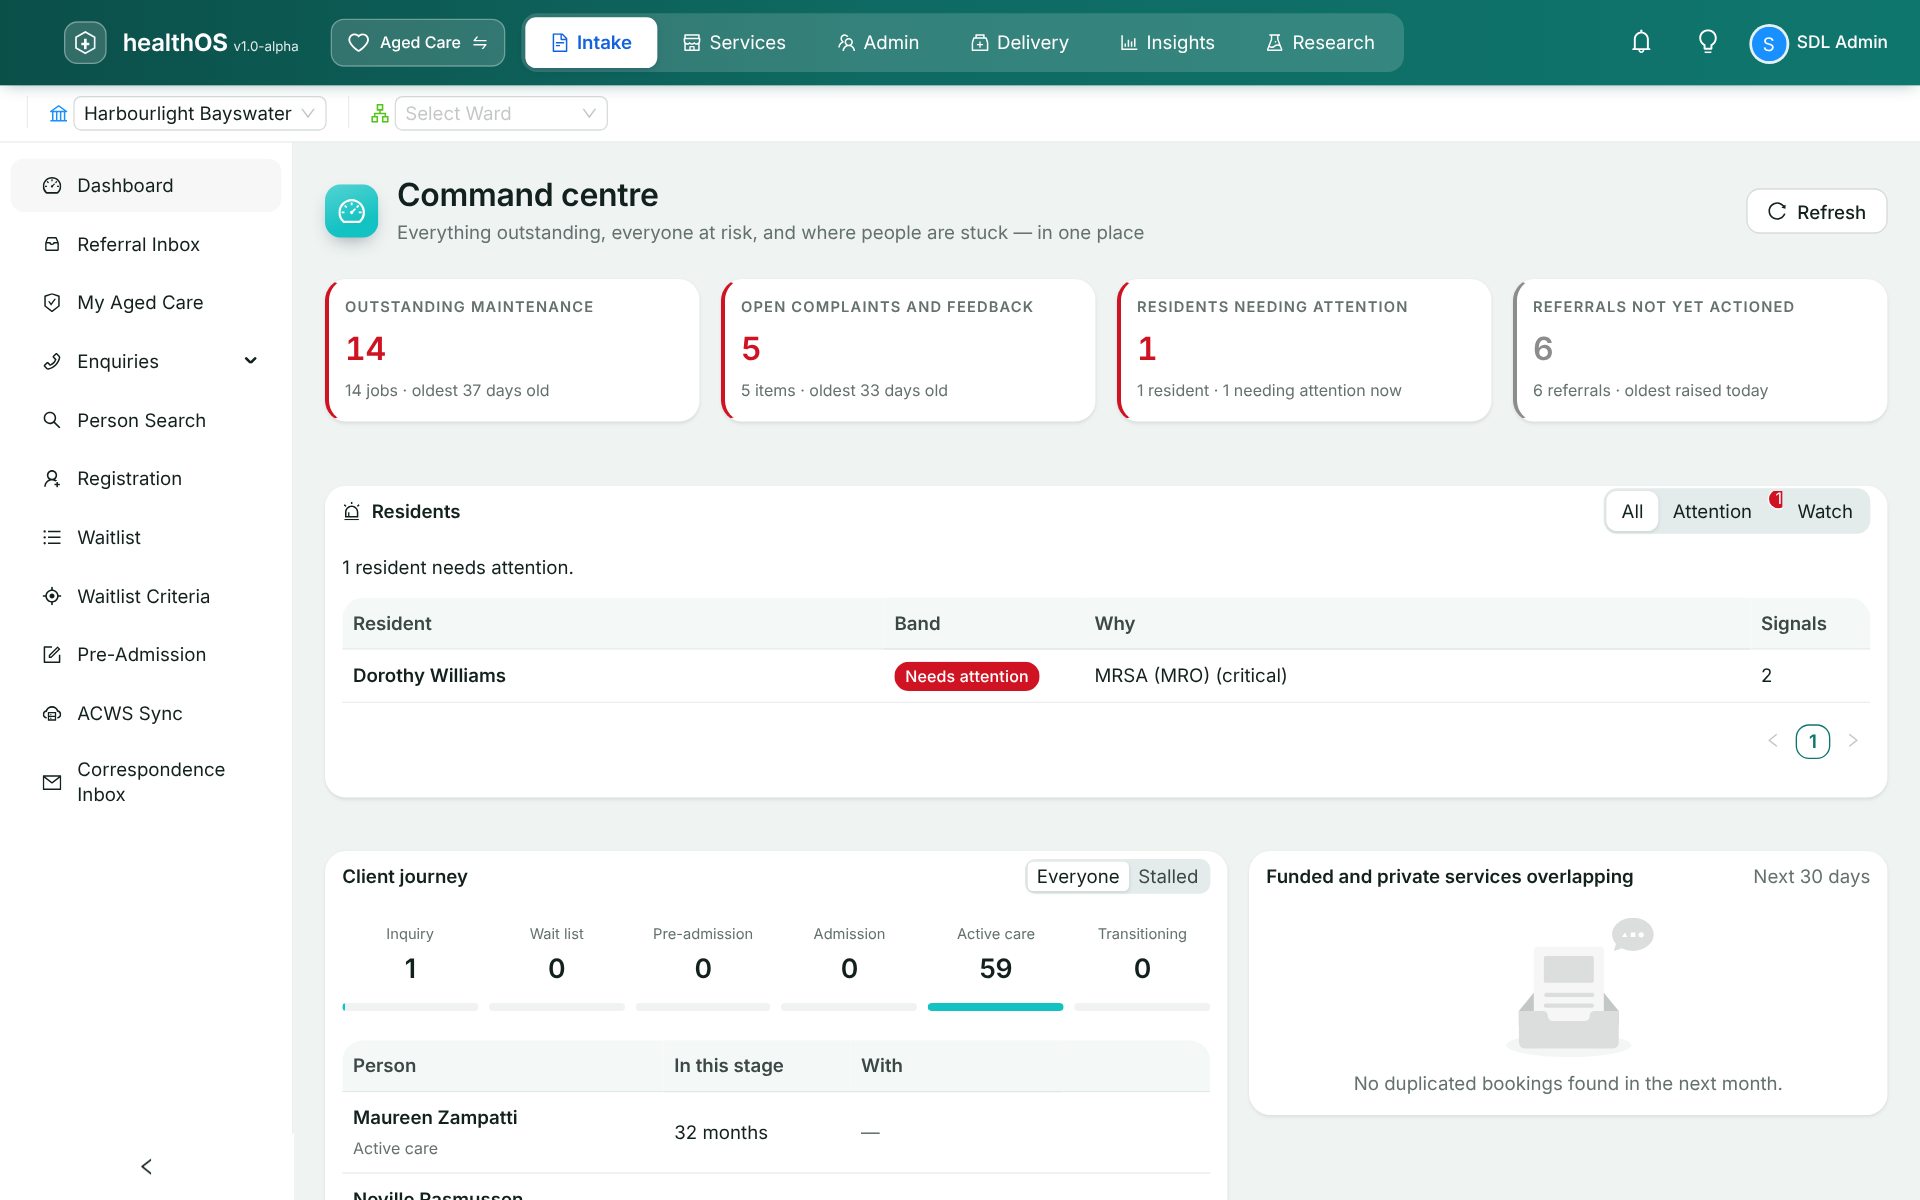
Pipelines and waitlists at a glance
Dashboards cover the intake pipeline, service delivery, waitlists and compliance, from the CEO’s view down to the care coordinator’s.
Told when a measure drifts
Set a threshold on any measure, such as occupancy below target, falls above a monthly limit, or a resident losing weight, and the right people are notified when it’s crossed.
Your own BI tools still work
A built-in data warehouse holds census, incident and financial facts, including margin by service line. Connect your own reporting tools over SQL or FHIR bulk export. AN-ACC, care minutes and Quality Indicator facts are there too; claims facts are being built now.
Research that helps pay for care
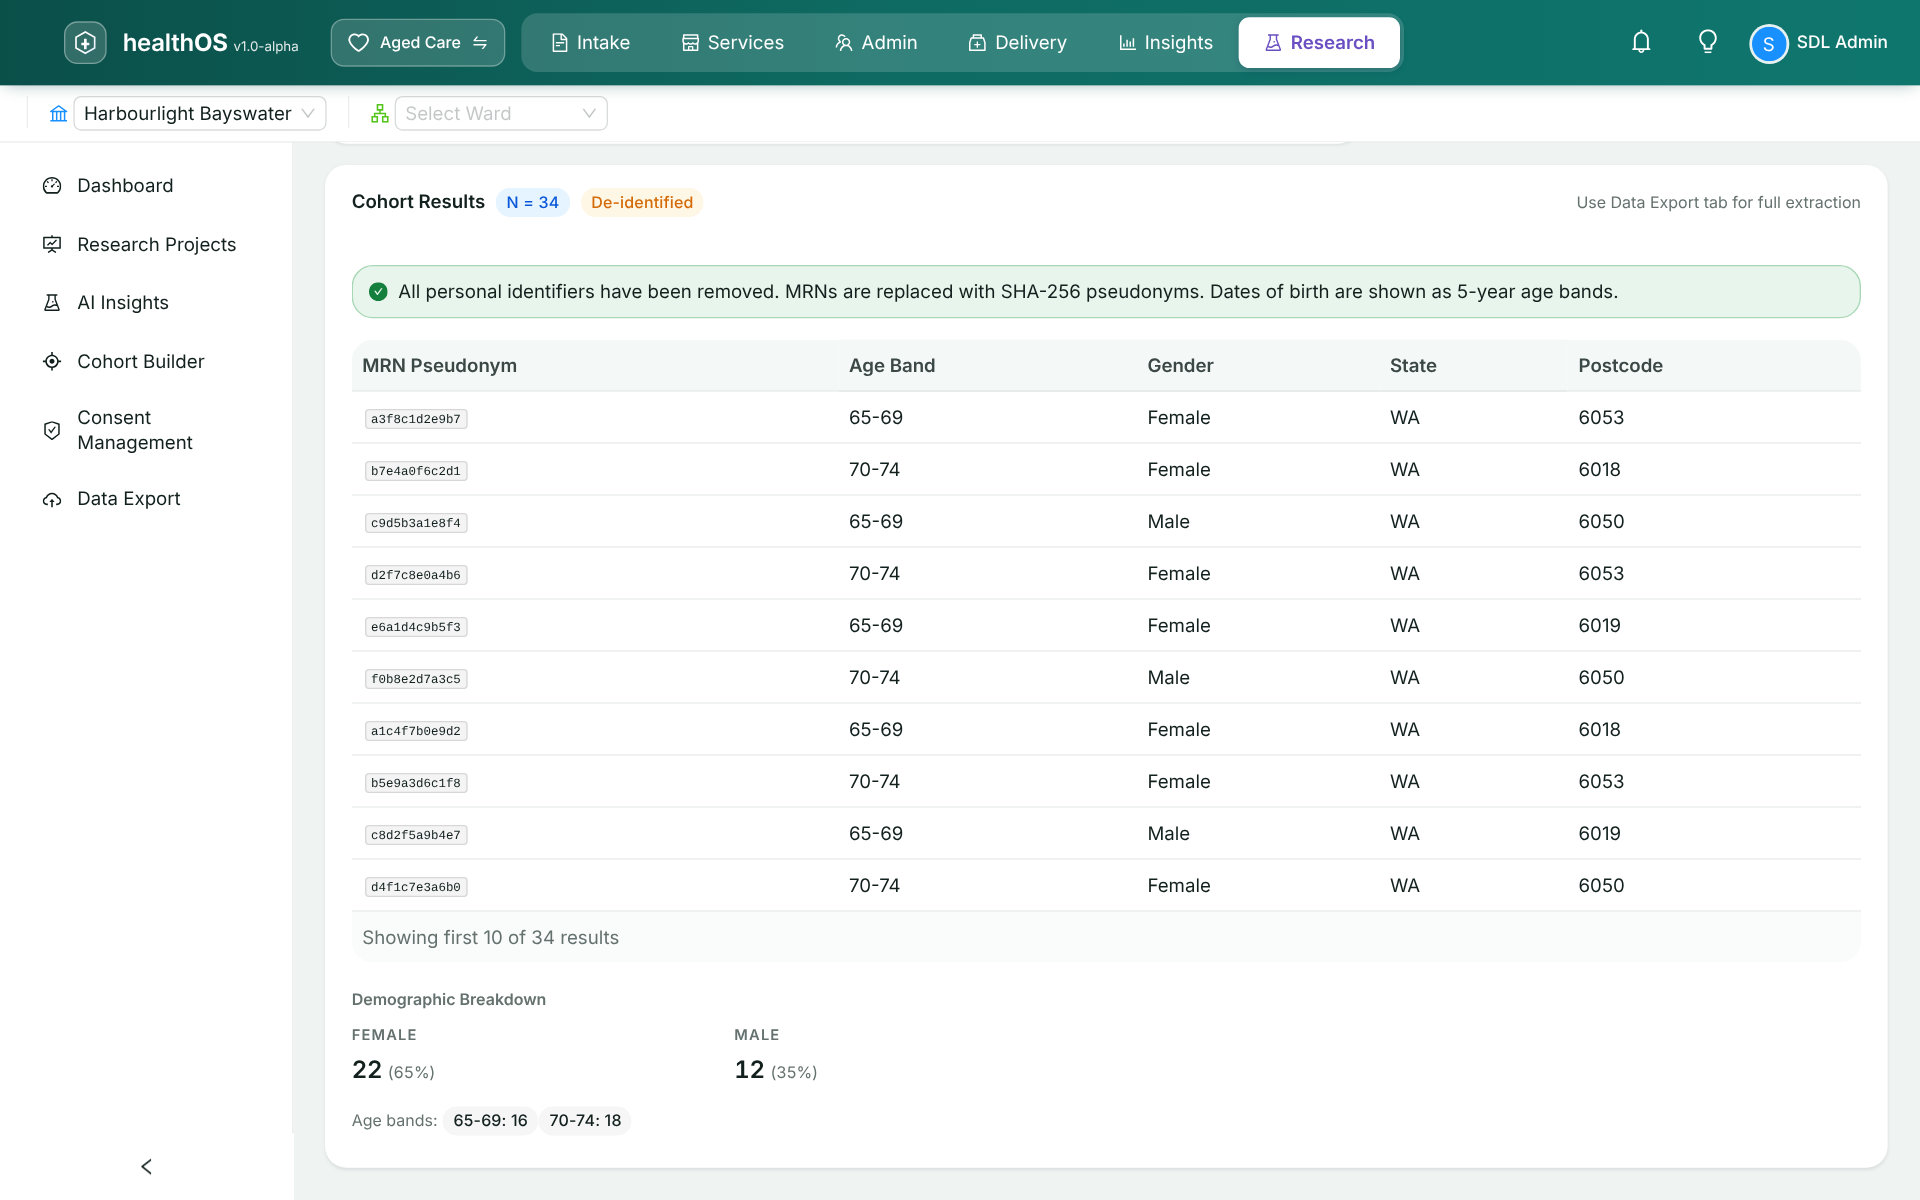
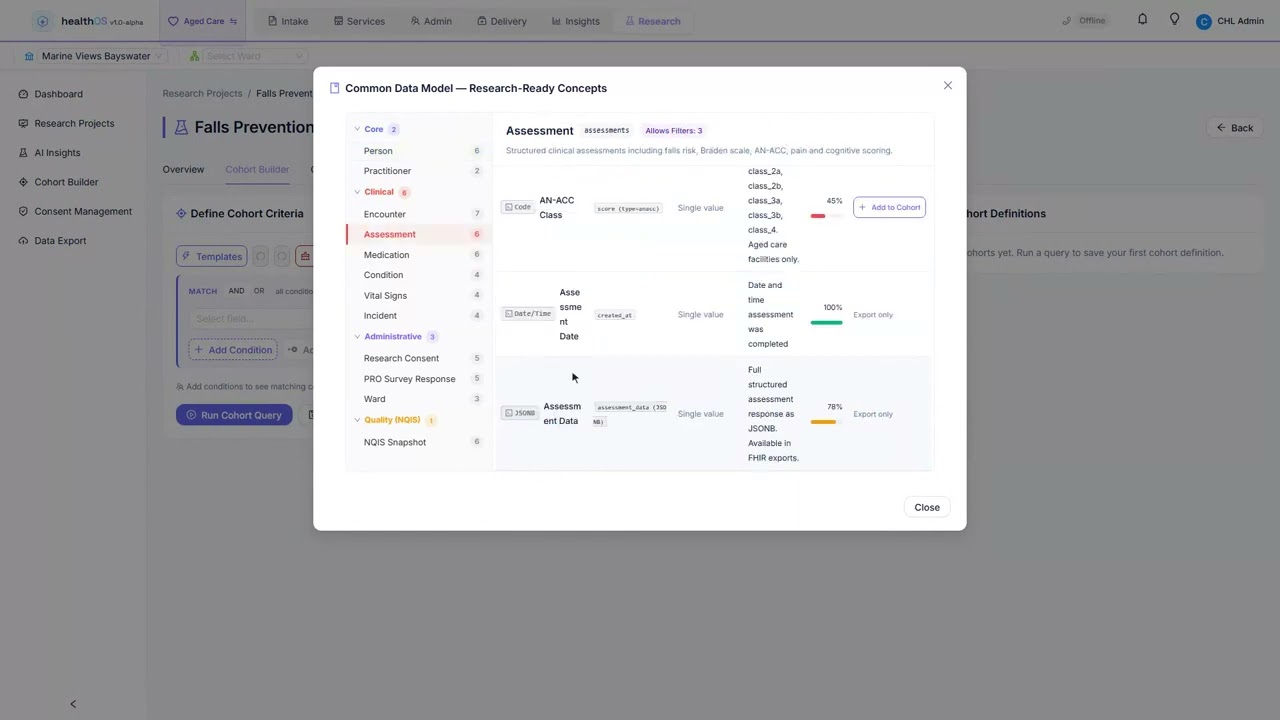
Build a cohort, de-identify it and export it for a research partner. Identifiers are hashed and dates of birth banded. Trials get randomisation, visit schedules and consent tracking, which opens the door to partnerships and grant funding.
See it in action
 1:56
Elsewhere in the care circle
Bring last month’s board pack
We’ll show you which numbers HealthOS would build, and where each one comes from.