Year end, sighted early. Know where the year will land, while there is still time to act.
NWAU Periscope reads activity from your PAS or your data warehouse and prices every episode in NWAU(26) by the National Efficient Price Determination 2026–27, so finance and casemix teams watch the year as it happens.
- The year end in view. Targets phased by month, the projected year end and the gap to target, recalculated every night as coding lands.
- The backlog counted on its own. Episodes still waiting to be coded are estimated and shown apart, and tonight’s inpatients are a separate estimate again.
- Figures the board can trace. Every figure opens down to the episode, marked as priced by the determination or as illustrative.
- Nothing to replace. Activity comes from the systems you already run, and no names or patient identifiers are kept.
Priced for your health service. NWAU Periscope is not sold by card. Talk to us and we will walk your finance team through it on a demonstration year of activity.
 5:46
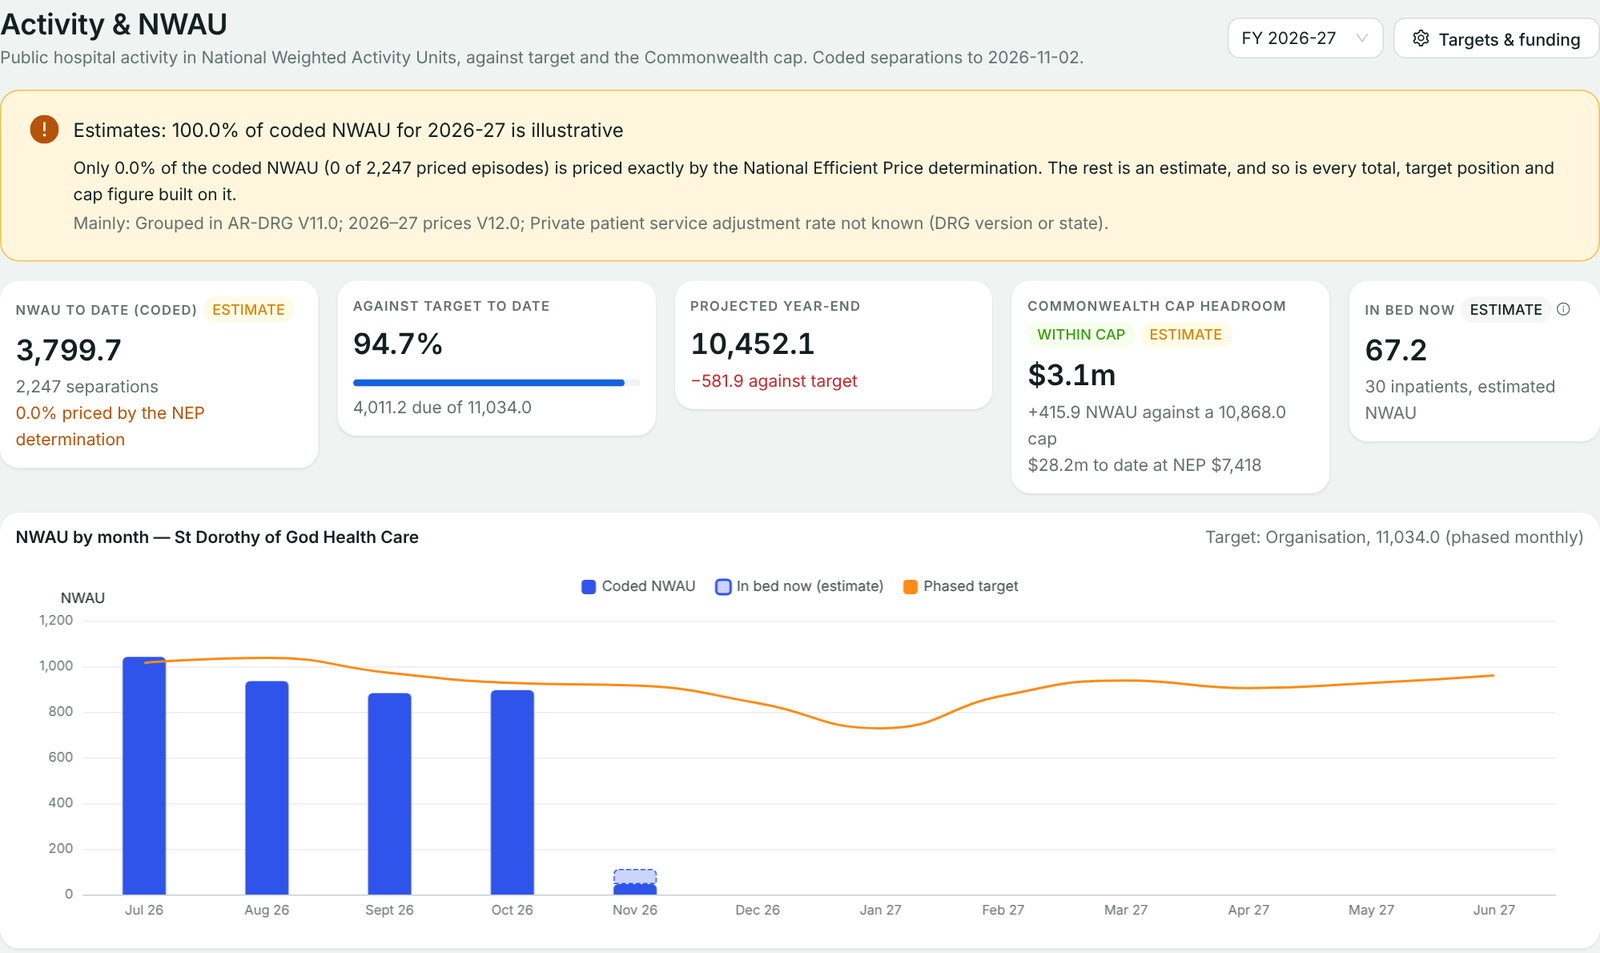
NWAU to date against a target phased to your year.
The projected year end and the gap to target, at every level.
Tonight’s inpatients priced as an estimate, kept apart from coded activity.
Headroom under the Commonwealth cap, in NWAU and dollars.
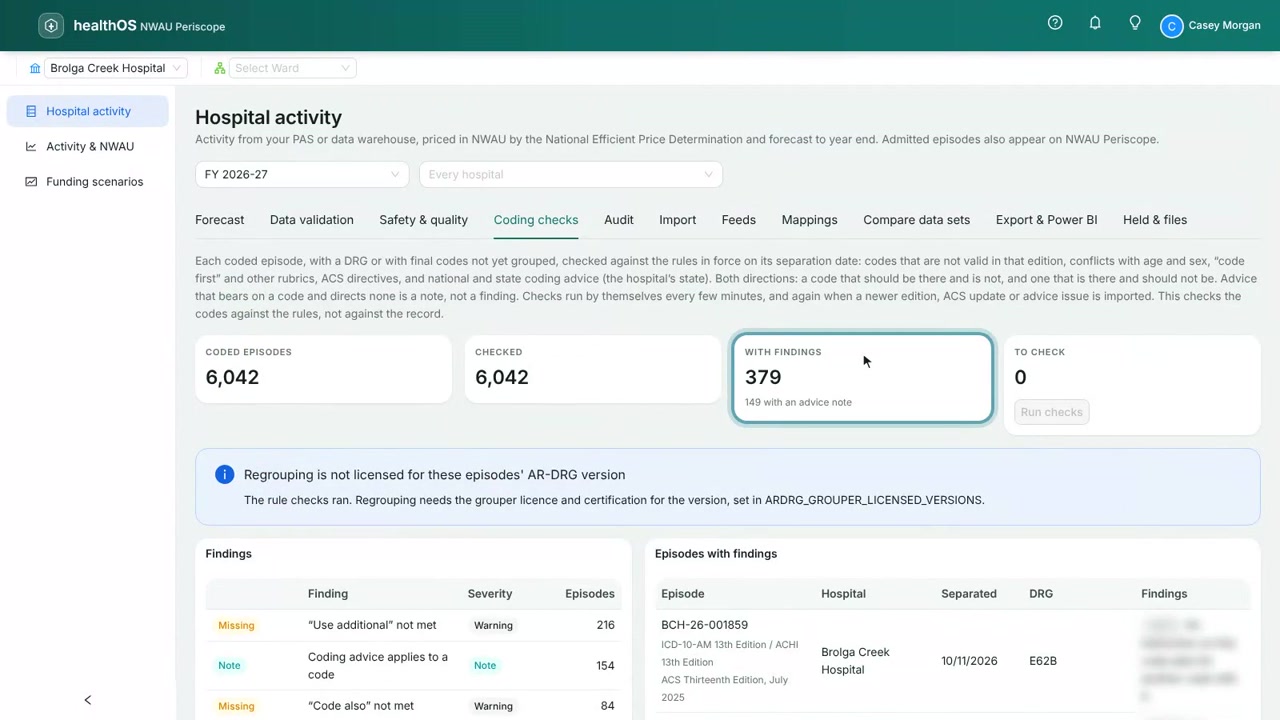
Invalid code combinations and missing codes listed for your coders.
Where the year stands, every morning
In most health services the year’s NWAU is pieced together from extracts, and the answer arrives when there is little left to change. NWAU Periscope prices the year as it happens, for your finance team, your casemix team and your board.
- By extract and spreadsheetActivity priced in batches, long after the patients have gone homeIn NWAU PeriscopeEvery episode priced in NWAU(26) as it arrives from your PAS or warehouse
- By extract and spreadsheetEpisodes waiting to be coded missing from the yearIn NWAU PeriscopeThe coding backlog estimated, counted in the projection and shown on its own
- By extract and spreadsheetThe patients in your beds left out until they are codedIn NWAU PeriscopeTonight’s inpatients priced each night as a separate estimate
- By extract and spreadsheetThe cap position worked out at year endIn NWAU PeriscopeHeadroom under the Commonwealth cap, in NWAU and in dollars
- By extract and spreadsheetReject reports read line by lineIn NWAU PeriscopeA worklist of data problems by hospital, rule and owner
Know your funding before year end
Finance and casemix teams watch the year against a phased target and the Commonwealth cap, with every figure priced by the National Efficient Price Determination.
A funding figure you can explain
Each episode is priced in National Weighted Activity Units by the National Efficient Price Determination 2026–27: the price weight for the stay, then each adjustment in the order the determination applies it, from paediatric and Indigenous status to remoteness, ICU hours and the private patient adjustment. The working is kept with the episode, so a figure can always be explained.
- NWAU(26) by the National Efficient Price Determination 2026–27
- Every adjustment kept, step by step, with the episode
- Admitted acute, subacute, mental health, emergency and non-admitted activity
See the gap to target early
Set an NWAU target for the organisation, each hospital and each division, and phase it by month, so a winter peak or a quiet January is planned for. From the year so far against that phasing, NWAU Periscope projects where each hospital, division and ward will finish the year, and how far that is from target. The method is stated on screen, so the people who answer for the money can explain the number to the board.
- Targets for the organisation, hospitals and divisions, phased by month
- Projected year-end NWAU at every level
- The projected gap to target, recalculated every night
A coding lag that never looks like a shortfall
Episodes that have left hospital and are still waiting to be coded are estimated from the coded mix of the same hospital, specialty and length of stay, and counted in the projection. Each night, tonight’s inpatients are priced from their provisional groupings by the same rules. Both are shown as estimates, each in its own tile, column and bar, and neither is ever added to coded totals.
- The coding backlog estimated and shown on its own
- Tonight’s inpatients priced as a separate estimate, nightly
- Both shown at every level of the drill-down
Know your headroom under the cap
Enter the National Efficient Price and your Commonwealth cap, and NWAU Periscope shows where the organisation stands: within it, near it or projected over it, in NWAU and in dollars at the published NEP. Every funding stream is counted, so the cap is measured against the hospital’s whole activity.
- Within cap, near cap or projected over cap
- Every funding stream counted, with NWAU by stream
- Headroom in NWAU and in dollars
Figures the board can stand behind
Every figure opens down to the episodes behind it, and says how it was priced.
Find which ward is behind
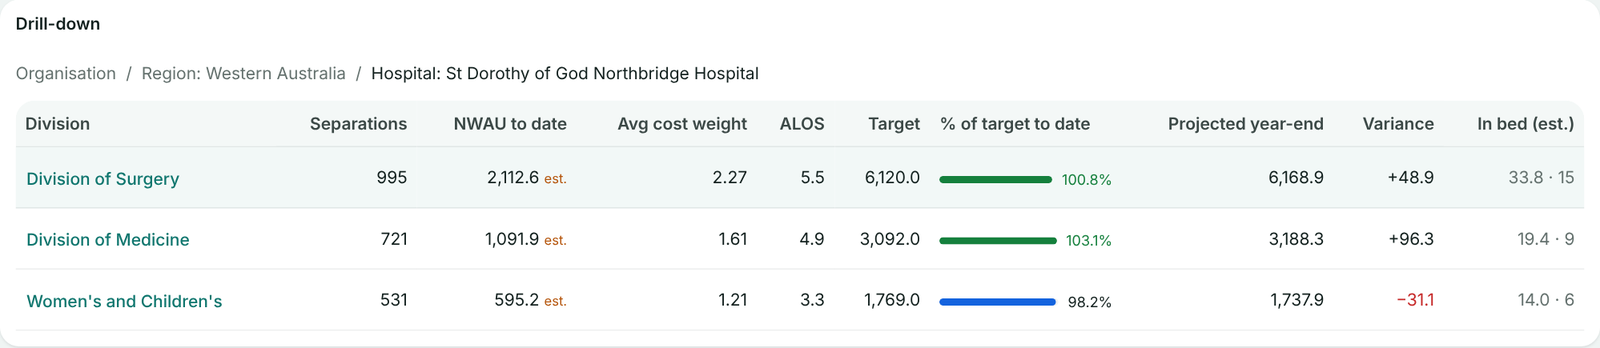
Every figure opens up: region, hospital, division, specialty and ward, then the episodes behind them, each with its own DRG and NWAU. When a division is behind, you can see which ward and which episodes.
- Region, hospital, division, specialty, ward, episode
- Each episode’s DRG and NWAU
- Coded and estimated activity side by side, never summed
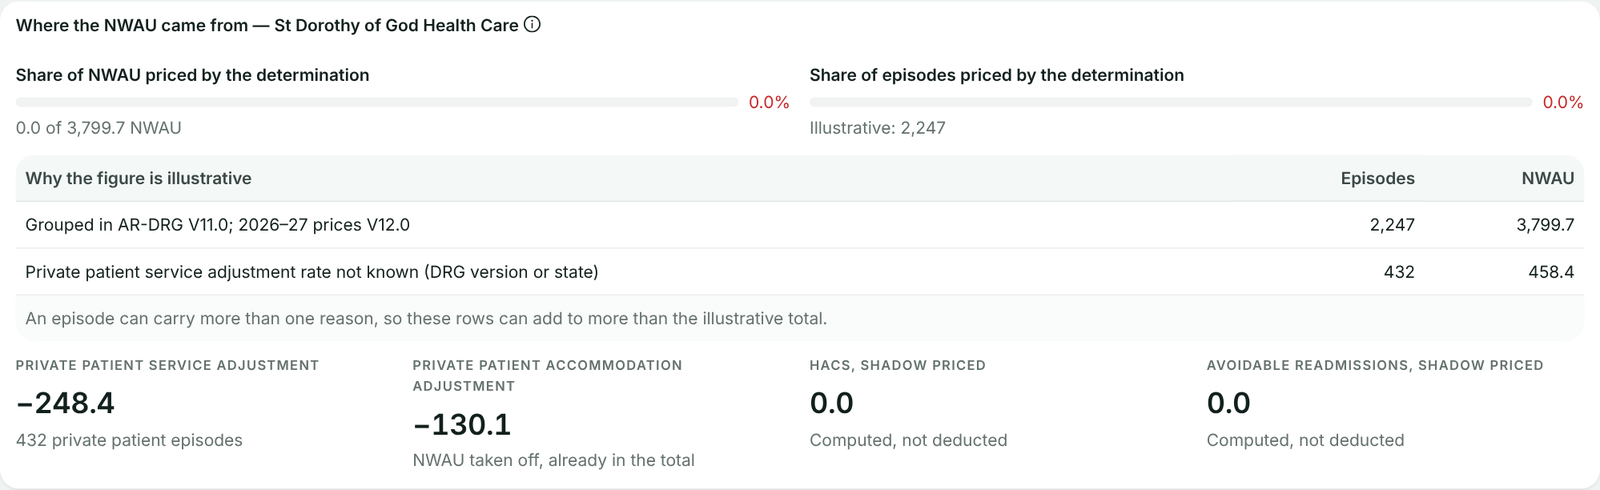
Every figure says how it was priced
Each figure is marked as priced by the determination or as illustrative, and the page says how much of the total is illustrative, broken down by reason. An extract for the state carries only the NWAU that was actually priced; a figure that was not calculated is left blank.
- Determination-priced or illustrative, on every figure
- The illustrative share stated, with the reasons
- Extracts report only what was priced
Read from your PAS or your data warehouse
NWAU Periscope takes activity from your patient administration system or your data warehouse, whichever you use. From the PAS, admissions, discharges and coding arrive as they happen, as HL7 v2 messages from your integration engine or over FHIR, or its database is read on a schedule. From the warehouse, a view is read on a schedule, or the warehouse pushes the extracts it already produces for national reporting to a secure SFTP drop, where each file is imported and then deleted.
The patient identifier becomes a pseudonymous key on arrival, so no names or patient identifiers are kept and no patient record is created. An episode that arrives with its codes but no DRG is grouped where your site is licensed for that AR-DRG version; otherwise it is held as coded but not grouped, with the reason, and counted in the backlog estimate.
- Admissions, discharges and coding live from the PAS
- Warehouse extracts read on a schedule or dropped over SFTP
- No names or patient identifiers kept
A year the whole team can trust
The data team and the coding manager each work a list of what needs fixing, and the same numbers reach the reports your board already reads.
Fix data problems before they reach the state
Every problem in an extract becomes an issue on a worklist: the record, the rule it broke, why that matters and who owns it at each hospital, so the data team works a list instead of reading reject reports. An issue closes when corrected data arrives. Add your own rules beside the built-in checks.
- A worklist by hospital, rule and owner
- Your own rules beside the built-in checks
- Issues closed when corrected data arrives
Coding gaps found in time
NWAU Periscope looks for invalid combinations of codes and missing codes, based on publicly available coding advice. Every imported episode with final codes is checked by the advice in force on its separation date, for the hospital’s own state, and each finding is listed with the episodes behind it for your coders to review. When new advice is loaded, the year is checked again.
Where your site is licensed for the AR-DRG version, each episode is regrouped and a DRG that differs from the one sent is flagged. No funding figure sits beside a finding.
- Invalid code combinations and missing codes listed
- The hospital’s state advice, as well as national advice
- Re-checked when the advice changes
Know what changed between submissions
Compare the warehouse’s extract with a corrected file, two extracts with each other, or what is held with a new file. Both sides are priced the same way, now, and matched episode by episode, so any difference is in the data. You see the episodes added, removed and changed, totals by hospital and DRG shifts, and can download the differences side by side.
- Matched episode by episode, on the episode number
- Totals by hospital and DRG shifts
- Comparisons kept for colleagues to open
The same numbers in your board’s reports
Download the year’s priced episodes, the other funding streams, your targets and the data quality worklist as CSV, or point Power BI at a feed that refreshes on its own schedule with a token you can revoke. Every dataset is de-identified: an episode is its episode number, which your costing system can join on.
- CSV downloads
- A Power BI feed for scheduled refresh
- No names or patient identifiers in any export
What it will never do
Funding figures beside coding invite the wrong question, so NWAU Periscope is designed to keep them apart.
| Rule | Why |
|---|---|
| No money beside an individual code | NWAU and dollars are shown for an episode, a ward or the organisation, never as what a single diagnosis or procedure is worth. |
| Estimates kept apart from coded activity | The backlog and in-bed estimates and illustrative figures are labelled wherever they appear, and never added to coded totals. |
| Nothing invented for the state | An extract carries the NWAU priced from the determination, or leaves the field blank. |
What we need from you
Your targets and their phasing, the NEP and your Commonwealth cap, and a feed or file drop from your PAS or warehouse, with its hospital and ward codes matched to yours once. The price weights come from the published National Efficient Price Determination, and remoteness from the ABS postcode correspondence, loaded once.
Priced for your health service
NWAU Periscope is priced for each health service, so it is not on self-serve signup. Talk to us about your hospitals and how your activity is held, and we will walk your finance team through it on a demonstration year of activity before you decide.
What health services ask us first
| Question | Answer |
|---|---|
| How is the year end projected? | From the NWAU coded so far, plus the estimate for episodes awaiting coding, against your monthly phasing of the target. If the year stands ahead of what the phasing says was due by now, it is projected to finish ahead of target by the same proportion. It is a projection from your own activity, and the method is stated on screen. |
| Why are some 2026–27 figures marked illustrative? | The National Efficient Price Determination 2026–27 prices AR-DRG Version 12.0. An episode grouped with Version 11.0 cannot be priced from those weights exactly, so its figure is marked illustrative and the page says how much of the total that affects. |
| Do you keep patient details? | No. The patient identifier becomes a pseudonymous key as the activity arrives, no names are kept, and no patient record is created. Every export identifies an episode by its episode number. |
| Who can see it? | Finance, casemix and executive roles, with the data team and coding manager working their own lists. |
| Can we sign up online? | Not for NWAU Periscope. It is priced for your health service: talk to us. |
Price weights and adjustments from the National Efficient Price Determination 2026–27, © Independent Health and Aged Care Pricing Authority, used under CC BY 4.0.
Watch a year come into view
5:46See where your year will land
NWAU Periscope is priced for your health service. Tell us how many hospitals you run and whether your activity is held in your PAS or a data warehouse, and we will walk your finance team through it on a demonstration year of activity.